P3 A – Explore
commercial uses for social media websites, including a) advertising
Display
Advertising
Display advertising on social media is the use of web banners
or banner ads placed on third party websites. These banners can consist of
static or animated images, as well as interactive media including videos or
audio messages. Display advertising uses demographics and location targeting-
using the person’s cookie and browser history to determine location and
interests to target appropriate ads to Facebook, Twitter and Instagram. This
therefore enables the adverts to become more effective, as the user is more
likely to find interest in the topics involved or products being sold.
Facebook Advertisements


Facebook
advertising statistics and facts
Total number of active Facebook advisers: 4 Million Advisers
Percentage of all Facebook pages that advertise on Facebook:
6%
Percentage of Facebook advertisers that come from outside the
US: 70%
Growth in Facebook advisers from 2015-2016: 50%
Percentage of Facebook advertising budgets that is dedicated
to mobile: 57%
Average Facebook Ad click through rate (CTR): 0.9%
Average Facebook Ad cost per click (CPC): $0.64
Average Facebook Ad cost per thousand impressions (CPM): $7.29
Average Facebook Ad cost per app install (CPI): $3.85
Global click through rate on a Facebook mobile app install ad:
0.6%
The
statistics found were last updated on 06/12/2015
Twitter
Advertisements

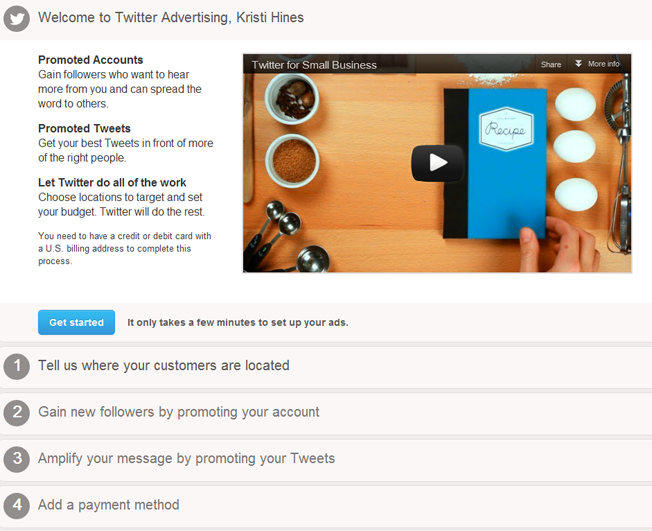
Twitter Advertising Statistics
Percentage of Twitter’s revenue that comes from mobile: 86%
Number of active Twitter advertisers: 130,000
Percentage of total Twitter advertising purchased that belongs
to Promoted Tweets: 88%
Offline sales increase attributed to promoted tweets: 29%
Advertising revenue per thousand Twitter timeline views: $1.77
Number of ad requests Twitter gets monthly on Mo Pub: 335
billion ad requests
Number of devices Twitter places ads on monthly through Mo
Pub: 1 billion devices
Number of countries/ territories that the Twitter ad platform
is available in: over 200
Increase in website clicks from a Twitter ad when it doesn’t
include a hashtag or @ mention: 23%
Twitter’s share of the global digital advertising market:
0.84%
Twitter’s share of the global digital advertising market: 2.6%
The
statistics found were last updated on 12/15/14
 Instagram Advertisements
Instagram
Advertising Statistics
When conducting a study, it was found that 8% of accounts on
Instagram are fake. The same study showed how 29.9% of accounts are ‘inactive’,
meaning they post one or fewer photos or videos in a month.
When Instagram introduced videos, more than 5million were
shared in 24 hours.
Instagram
Marketing Statistics
48.8% of brands are on Instagram. This was predicted to rise
to 70.7% by 2017.
When looking at the top brands in the world, 90% of these have
an Instagram account.
96% of US fashion brands are on Instagram
Outside China, almost 50% of Instagram users conduct product
research on social media
Engagement with brands on Instagram is 10 times higher on
Facebook, 54 times higher than Pinterest, and 84 times higher than Twitter
Over a third of Instagram users have used their mobile to
purchase a product online- making them 70% more likely to do so than non-users
32% of US teens list Instagram as their most important social
network, more than any other social network
50% of Instagrammers follow brands, making them the social
networkers who are most likely to do so
Source: https://business.instagram.com/
Source: https://business.instagram.com/

No comments:
Post a Comment